
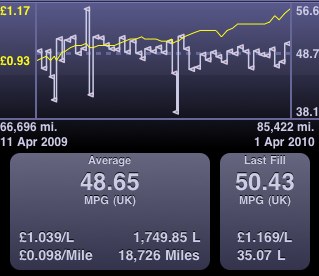
Last year (on 11th April 2009 to be precise) I starting using the Road Trip application (the Lite free version of course!) for my iPhone, initially this was to monitor my fuel efficiency (which happens to be about 49MPG) but it’s actually been more useful in helping to keep track of my fuel costs.
I commute to and from work every day – a round trip of just over 70 miles per day, 5 days a week. On average I drive about 1500 miles per month (or to look at another way, about 75% of the circumference of the earth each year). Public transport is available but would require a 20 minute walk to the bus station to catch the bus at 6.25am and taking a taxi from the bus station at the other end to my work. It’s more hassle, more expensive (see here) and less comfortable. However, given the rising cost of fuel I wouldn’t be surprised if in another few months it will be cheaper to use public transport!

On the 11th April 2009 unleaded petrol cost £0.929 per litre, today (10th April 2010) it costs £1.179 – that’s a rise of 25p. It’s clear from the yellow graph that there has been a steady upward trend over the past 12 months but what factor has had the biggest impact?
VAT
VAT is charged on the cost of fuel plus duty. VAT rates did change during this period; from 1st December 2008 until 31st December 2009 VAT was charged at a lower rate of 15%. Since 1st January 2010 VAT has been charged at 17.5%. From the data I have collected I found that between 16th December 2009 and 6th January 2010 the price of fuel rose from £1.039 to £1.069. The actual price of fuel on the 16th December 2009 I determined to be £0.3416 whilst on 6th January 2010 I calculated it to be £0.3479 (these figures calculated by removing VAT and duty). If the 15% rate was still active today fuel priced at £1.179 would actually cost £1.154. Rounding up, the increased VAT rate was accountable for (at most) a three pence rise* in fuel costs in the past 12 months.
Of course as the actual cost of fuel rises or as the duty rises so too does the VAT paid:
| Date | Total VAT paid (ppl) |
|---|---|
| 11th April 2009 | 13.55 |
| 10th April 2010 | 17.56 |
| Increase | 4.01 |
So as a result of the VAT rate change, increased duty and increased actual fuel cost I’m paying 4.01 pence more VAT compared to this time last year.
Fuel Duty
Fuel duty (or Hydrocarbon Oils duty to give it’s more official name) is now 57.19p per litre following the 1p increase on 1st April 2010 (see here for a PDF of the current rates from HMRC). I’ve compiled the most recent rates and future rates in the table below.
| Date | Duty Rate (ppl) |
|---|---|
| 1st December 2008 | 52.35 |
| 1st April 2009 | 54.19 |
| 1st September 2009 | 56.19* |
| 1st April 2010 | 57.19 |
| 1st October 2010 | 58.19 |
| 1st January 2011 | 58.95 |
From the table it’s clear that fuel duty has risen by three pence (ex. VAT) since 11th April 2009.
Taking VAT into account on the duty alone:
| Date | Duty Rate inc. VAT (ppl) |
|---|---|
| 11th April 2009 | 62.32 |
| 10th April 2010 | 67.20 |
| Increase | 4.88 |
This increase of 4.88 pence is Mr Darling’s responsibility. I calculated these figures as it is important to highlight that an increase in duty of say one pence actually adds more than one pence to the price of fuel when you factor in VAT. Those figures presented above would be the price you would pay to the government if the actual cost of the fuel was £0 (and there was no forecourt profit or other associated costs).
The actual cost of fuel
The remaining cost (which I have referred to as the ‘actual cost’) is the combined cost of the fuel itself, forecourt profits, transportation costs and any other associated costs. I’ve calculated costs at quarterly intervals over the past 12 months.
| Date | Pump price (ppl) | Duty and VAT (ppl) | Actual cost (ppl) |
|---|---|---|---|
| 11th April 2009 | 92.90 | 66.31 | 26.59 |
| 13th July 2009 | 99.90 | 67.22 | 32.68 |
| 9th October 2009 | 101.90 | 69.48 | 32.42 |
| 13th January 2010 | 107.90 | 72.26 | 35.64 |
| 10th April 2010 | 117.90 | 74.75 | 43.15 |
It’s difficult to determine the exact reason for the rises in the ‘actual cost’. I’ve heard some arguments about the influence of the US Dollar exchange rate (a 1 year graph of rates is here) however the pound is slightly stronger now (approx. 1.53) than it was in April 2009 (approx. 1.47). Although I admit it has weakened since the start of this year. The BBC did report here that if currency rates were at 2008 rates petrol would be 10 pence per litre cheaper now but this seems irrelevant in our comparison considering the rates in April 2009 are weaker than in April 2010.
The price of oil is higher but not ridiculously high – according to this BBC article:
…oil currently costs about $85 a barrel, well below the $147 a barrel it cost when petrol prices were last this high.
In April 2009 an oil barrel (containing 159 litres of oil) cost approximately $50. This is an increase of about £23 per barrel. I’m not sure of the yield produced from a barrel (I’ve found various answers online) and there are also other products produced and sold so I’m unsure exactly how much this would increase prices.
The final factor to consider is profit, oil and fuel are big business and it’s quite likely that some of the increase is as a result of companies increasing prices to make a profit but again it is difficult to determine exactly how much this would account for.
Conclusion
Whilst it’s shocking that we pay so much duty and tax on a litre of fuel (almost 75p) the increase in recent months hasn’t been solely to blame on the Government, in fact it is the actual cost which has risen by 16.56 pence (ex. VAT) that has been the biggest factor. Indeed, looking at a graph of the cost breakdown for my fuel expenditure over the past 12 months it is quite clear that the actual cost (green) is trending closely with the total cost (black).

*Arguably you could say VAT was responsible for a 5 pence rise as the 2p increase in fuel duty on 1st September 2009 was supposed to have been brought in to cover the loss of tax experienced as a result of the lower VAT rate!